Published by Jeremy. Last Updated on May 11, 2026.
Disclaimers: Our site uses demographic data, email opt-ins, display advertising, and affiliate links. Please check out our Terms and Conditions for more information. Listed prices and attraction details may have changed since our visit and initial publication.
When we decided to go on a trip to view the northern lights, we went down the science rabbit hole of how aurora forecasts work. We thought that if we had a good understanding of how all the measurements are made, we could increase our odds of seeing the northern lights.
As it turns out, reading aurora and solar activity charts is not easy (and I say this as Angie and I hold a small stack of engineering degrees between the two of us and I’ve taken an entire year’s worth of astronomy for good measure). For those who are not as nerdy as we are, looking at these charts can be quite daunting and may cause you to simply stick to the analog of the KP Index and call it a day.
So in this one, we thought we’d share a few of our favorite things to watch out for on aurora tracking sites like Space Weather Live to help you better understand the charts that you may be looking at!
📍 How to Read Aurora Forecasts – A Quick Guide
- KP Index Measures Oval Size: KP Index is only a measurement of the size of the aurora oval, which is much more important when viewing outside of the Arctic Circle- the bigger the oval, the more south the aurora could possibly be seen (but inside the Arctic Circle, you may get a good show even at KP1)
- Readings that Matter – If you’re inside the oval, magnetometer readings shows when activity is rising (a negative nT reading is a good sign) and the Bz Index shows direction of the solar winds- south is better as its closer to the atmosphere
- 24-48 Hour and 30-60 Minute Notices: Visual observations of sun activity can often alert to potential aurora activity a day or two in advance, and satellites may be able to give a 30 to 60 minute warning; however, nothing beats going outside and looking up at night
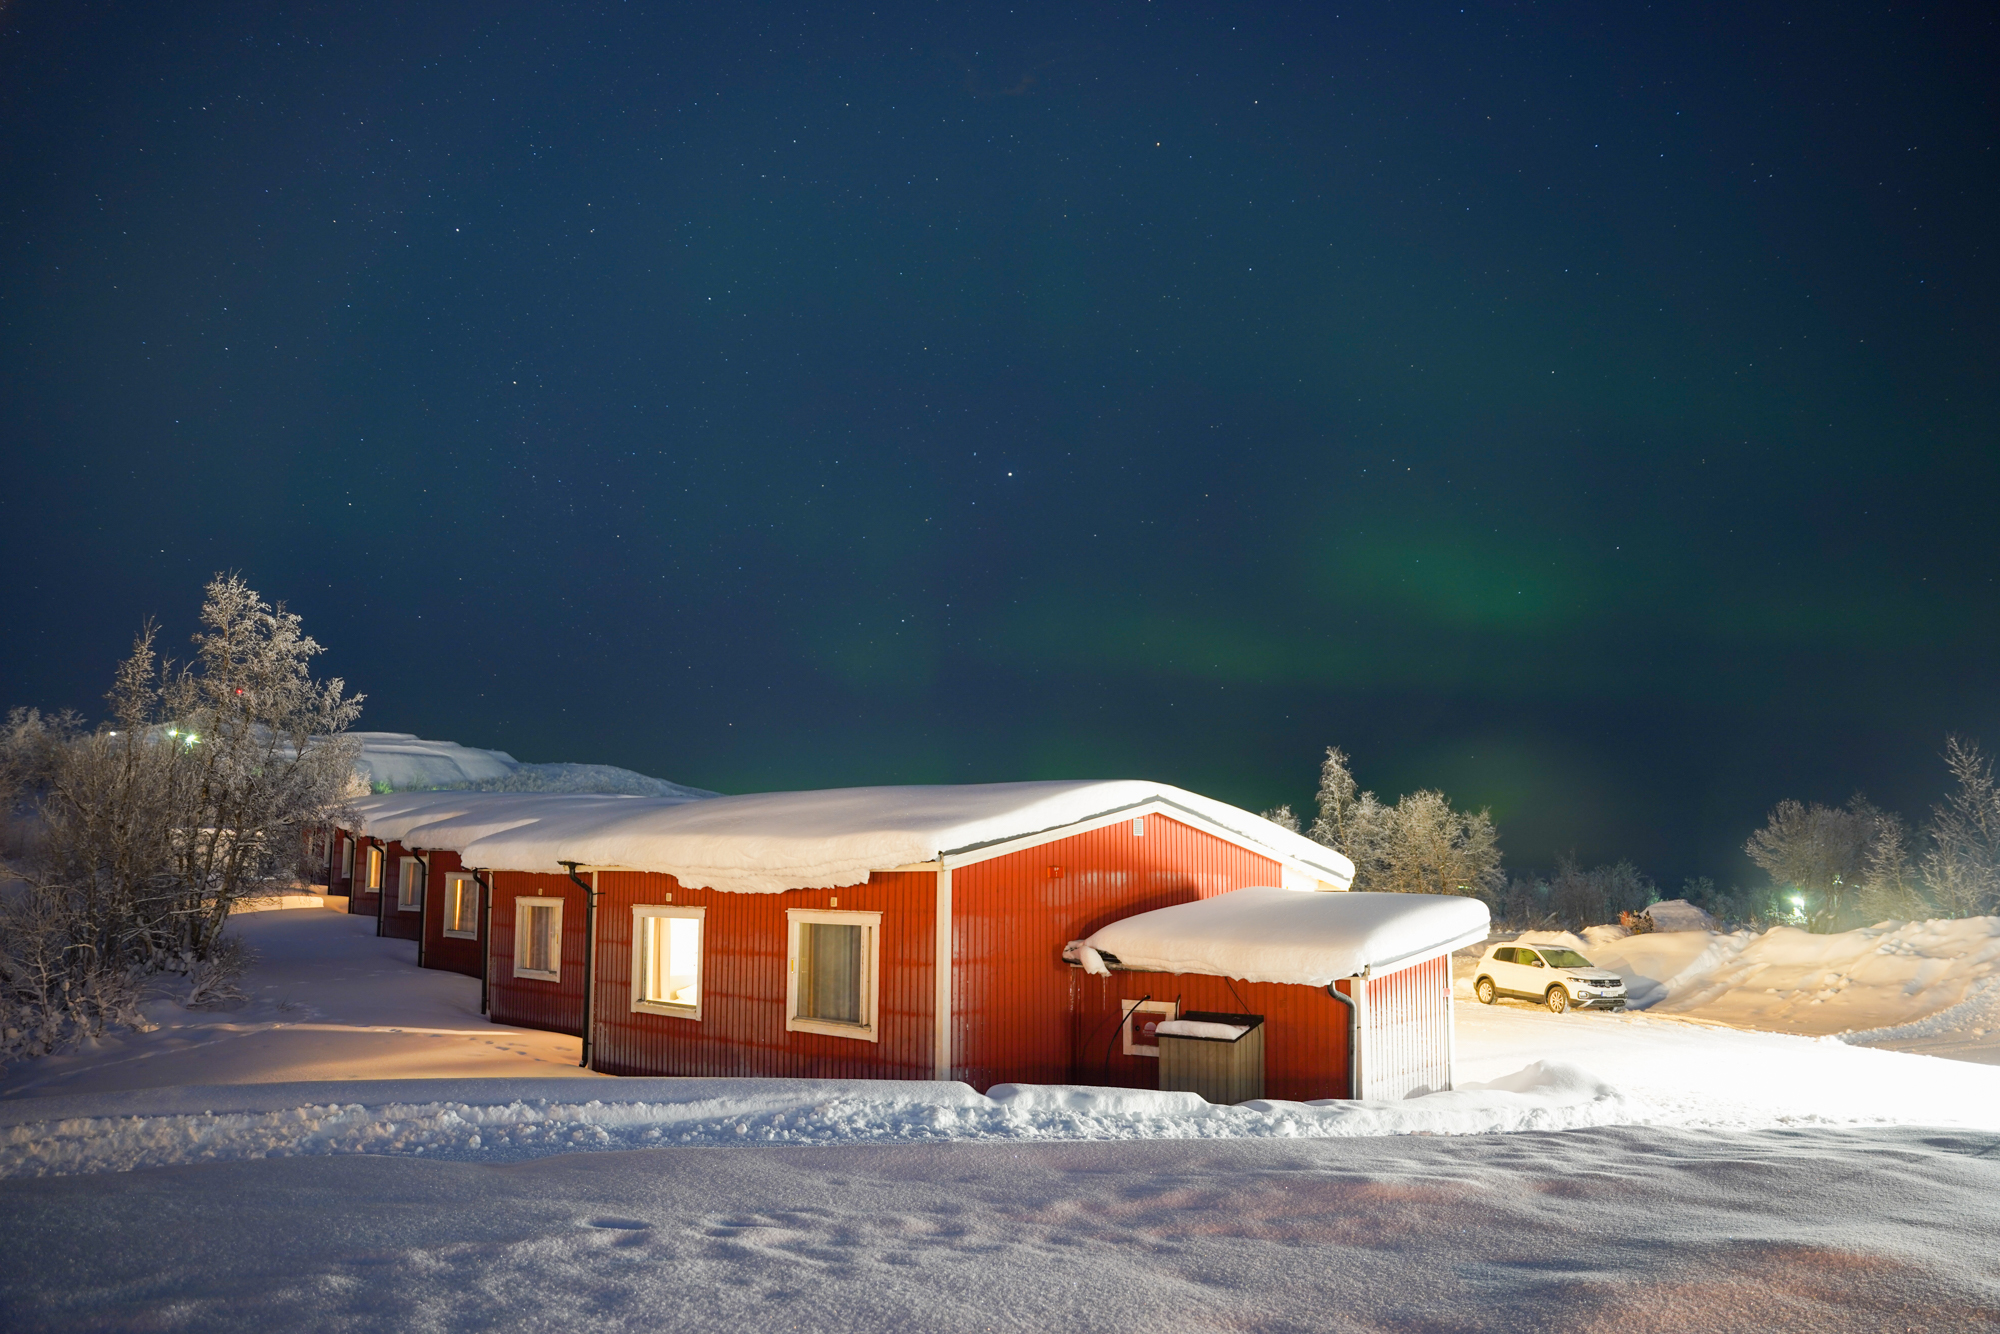
Looking to reserve an apartment in the Arctic Circle? Click here to book.
KP Index is a Measure of Oval Size
When you read northern lights tips, the top recommendation is almost always to check the KP Index for geomagnetic disruption (aka potential aurora activity). It is often used as an analog for the odds of seeing the northern lights as a higher KP Index is said to be greater aurora chances and/or intensity.
If you only base your aurora-watching on this number, it probably needs a bit more explanation. The index can be treated as an analog and will get you quite far in checking aurora activity to start, but it is only one piece of the puzzle.
This is because, to us at least, the KP Index should be treated as the size of the aurora oval first and foremost. Not its ability to be seen (there is no local weather factor in the KP Index!). Not the intensity you may be able to witness that very minute (although, intensity and size are often related as this one does take into account global magnetometer readings). We simply treat it as the size of the oval in the sky. The bigger the aurora oval, the larger the KP Index, and the more places you can potentially see it- especially as you travel further away from the Arctic Circle.
For example, the most common geomagnetic disruptions are on a scale of KP 1 to KP 3. These happen virtually all the time especially as we approach peak solar activity within any given cycle. By oval size, KP 1 to 3 means that the lights are often contained within the Arctic Circle proper. A KP of 1 is indeed low activity, but if you are in the Arctic Circle, we’d still go out looking for it on a clear night because the lights very much could be seen. For the aurora oval to be large enough to be seen further south, say, within the capital cities of the Nordic Countries, the index may need to be at KP 7 or higher- this may only happen a few days per year, if at all.
Will an aurora show be better at KP 5 over KP 1? We really can’t argue against that logic, size and intensity often do go hand-in-hand, but we treat the KP Index as a function of where you may be able to see the northern lights first and worry about the intensity factor later.
To put it bluntly, if the aurora oval is large enough that covers where you are standing- go outside and/or start looking at other factors that we’ll discuss in this post. If the aurora oval is not large enough to cover where you are standing- don’t go outside.
- To check out more maps illustrating sizes of the aurora oval at various KP Indexes, check out The Aurora Zone.
KP Index is Slightly Irrelevant in Arctic Circle
When you are seeking the northern lights within the Arctic Circle, the KP Index gets a little weird as you can likely see aurora activity (and possibly good aurora activity at that) at low KP Indexes.
Will the show be better if you were in the Arctic Circle under an aurora oval of KP 4, 5, or higher vs. a KP 1 or 2? As mentioned above, the answer is most likely yes. But when you are sufficiently far north the aurora oval will be above you almost all the time, so using the KP index scale as a starting point on whether you can see the aurora or not is somewhat irrelevant.
Yes, intensity is often proportional to the KP Index. If you are lucky enough to spot the aurora during a KP 9 event (which may happen just a few times per solar cycle!) and are in the Arctic Circle, you are probably in for a stellar show. That being said, a KP 9 oval also simply means it covers an area that is quite large, which means it goes quite far south, too. You can also likely see the aurora, albeit at much lower visible activity even at KP 1.
In the Arctic Circle, the oval is really almost always above you. Whether you can see it is another question entirely and now we need to get outside of the KP Index scale entirely!
Check Satellite Data 24-48 Hours and 30-60 Minutes Out
Now, you’re probably thinking, “if the aurora oval is always above me, what else can I do to determine when to go outside?” Well, funny you should ask, there are a few things you can look into that will help out with timing if you find yourself under the aurora oval that we, personally, found much more helpful than only relying on KP Index.
You may know that it takes roughly eight minutes for light to reach the Earth. But radiation does not travel at such insane speeds (although let’s be honest, several hundred kilometers per second is still quite fast).
As such, there are two ways scientists can predict aurora activity ahead of time that could help you refine your plans to go outside and look for the lights.
First, is watching the light coming from the sun in the form of ejections and other events. These are typically seen as fast as light travels, but the corresponding radiation from major events often doesn’t arrive until 24-48 hours later based on the speed of the solar winds (lesser events may be predicted even longer as they travel slower). This may be your first indicator that an aurora is incoming.
Second, NASA maintains a satellite, DSCOVR, approximately 860,000 miles from Earth that measures the radiation that is heading toward us. Think of it like an early detection system that will give us a heads up as radiation is incoming. As this one is much closer to the Earth than the sun, radiation that could hit the poles can be analyzed approximately 30-60 minutes out based on wind speeds.
So when you are prepping for an aurora outing, you have two useful tools to monitor. Space Weather Live has good resources for both checking real-time solar activity and real-time auroral activity that include information and charts about these two sources.
Breaking Down Some Aurora Charts
The satellite mentioned above sends a wealth of data back along with it, and those who are nerds like us can read the live charts at places like Space Weather Live.
Charts you may want to watch include:
- KP Index: Naturally, a higher KP Index does mean magnetic activity is rising. As this is often a global average and factors a broad range of time, we only use it as a starting guide. As mentioned above, if you’re in the Arctic Circle you may see the aurora starting at just KP 1, whereas if you’re further south you will need a sufficiently high KP to see anything at all!
- Local Magnetometer Readings: If you can find public data for a magnetometer near you (such as we had in Kiruna, Sweden), you may be able to see when local activity is rising- a better guide for instant, local activity than KP Index all around. A sharp drop into the negative in the nT reading is generally a good sign. (A lot of the aurora activity data plots go negative for more activity- yes it is counterintuitive!)
- Real-Time Solar Wind: Data sent back from the DSCOVR satellite showing solar wind and density where an increase in either may indicate something is coming. As the satellite is far away, these charts are able to forecast 30-60 minutes ahead and may give you an opportunity to prepare to go outside.
- Bz Index: A somewhat confusing plot within Real Time Solar Wind data that shows the direction of the solar winds relative to the magnetosphere. While defined as North and South for positive and negative values, it is best to think of these as locations in the magnetosphere not locations on the Earth proper. So in this instance, lower values (negative, “South”) often means activity is closer to the atmosphere where we can see whereas a higher (positive, “North”) value may indicate the activity is too high up in the atmosphere and we may not see it on the ground.
Let’s put all this together for an example to add some numbers here.
Normal solar wind speeds are under 400 km/second. If you spike above 400 km/second, it is considered elevated. Above 500 is moderate, 700 high, and 900 km/s very high. This likely means that some solar activity is being picked up by DSCOVR and is heading our way. Ejection events tend to move faster than normal solar winds, so a spike here makes sense.
The density of solar activity is often considered low at under 10 p/cm3. Greater than 20 p/cm3 is moderate, 40 is high, and 60 is very high. A spike here often coincides with wind speeds, and most charts will show an estimated arrival time for the solar winds the satellite is seeing now (adjusting for measured speed, of course). If you have a high density and high speed with a suggested arrival time at Earth in 30 minutes, you may want to prepare to go outside in 30 minutes.
Now the key (and quite honestly, confusing) bit- Bz Index. If the Bz Index is forecasting >0, and perhaps even closer to 5 or 10, the aurora activity will likely hit us quite high in the magnetosphere. So even if the sun is hurling a lot of radiation at us, we may not see it (some consider 0 to be the maximum for most spotting with the naked eye, but we wouldn’t rely on this exclusively). If the Bz Index is <0, particularly -10 or -20, then the activity will be much lower in the sky and can possibly be seen- especially if the density and wind speeds indicate something is coming our way.
Again, this is also coming from the satellite and can be forecast ahead of time based on solar wind speeds. If all of these charts align, you should definitely prepare to be outside at whenever the charts peak (or crater- pending on which one you’re looking at).
Local magnetometers are where you will then switch to the activity being seen on the ground right now, but only where the magnetometer is located. So if you’re in Kiruna, Sweden, reading the Kiruna magnetometer will be an excellent resource. But if you’re in northern Canada and reading the Kiruna magnetometer, results will likely vary due to the larger distance. In any case, when solar activity hits the Earth, these drop into the negative nT values and indicate that there is more activity locally. So if you are near a magnetometer and it is showing a disturbance, you may want to go outside immediately.
So, to summarize, data from DSCOVR satellite may give you an indication of when to go out in the next hour, but local magnetometers may be a good gauge of when to go out right now. If the stars align and all of these numbers are looking favorable, check the weather and go outside!
Local Weather is the Aurora Killer
So, an aurora may be imminent, what next? Check local weather, of course!
The real shame of chasing the aurora borealis is that, despite the oval being above the Arctic Circle almost constantly, the northern lights are only seen in the upper atmosphere. All pesky weather conditions we are used to like clouds, rain, snow, and more take place in the lower atmosphere and, as it often does, can block the aurora outright.
The best aurora display in the world means nothing if clouds in the lower atmosphere prevent it from being seen. In fact, we had several KP 3 – KP 5 events taking place during our stay, indicating the potential of increased activity, but we didn’t even bother checking the stats mentioned above simply because where we were located had 100% cloud cover all night long.
Yes, the feeling is as depressing as it sounds. So just be sure to check the weather forecast as clouds will block you from seeing anything at all!
Apps Can Give Alerts, But They Aren’t Perfect
If you find the above far too tedious, you may simply want to sign up for alerts via apps like My Aurora Forecast.
These apps can send push notifications straight to your phone when a combination of data points indicates a high probability to see the aurora. Think higher KP index, clear skies at your location, etc. Many of these use a proprietary combination of factors, likely including many of the data sets we mentioned above, so it is hard to say with absolute certainty what all is included or excluded for alerts here.
There are many problems with apps like these that we must mention:
First is that if the KP Index is low, you are in the Arctic Circle, and the sky is clear, you may still see the aurora whether an app notifies you or not. Most apps appear to have a threshold of activity to trigger a push notification and, case in point, we never received any push notifications during the times we actually saw the aurora.
Second is that you, naturally, need a cell signal or wifi to receive notifications outright. We paid for an international data plan and had a shockingly good cell signal in both Kiruna and Abisko, Sweden, but others in more remote locations may not be so lucky.
Third is that you need to set it to be able to alert you in the middle of the night with other app notifications turned off. We set up DND mode to turn off notifications from all apps and set our aurora tracking app as the sole exception. No Facebook messages or phone calls waking us up in the middle of the night, just the important aurora alert! That being said, DND features are typically phone-based settings, not app-based- so your phone needs to offer a function like this to make it all work.
Overall, while apps could be quite good for alerts when you’re planning to sleep, there is a level where we found they were less effective. The one night we got a ton of push notifications (a KP 5 event was going on) was the night we had 100% cloud cover. So people were clearly seeing the aurora near us, but it wasn’t in Kiruna, and the alert did us little good. Talk about a sad night’s sleep there!
Ditch the Charts/Apps and Look North
Finally, when all else fails, simply go outside (preferably to a dark place) and look north. Seriously!
We were shocked at how many times we spotted the lights on our last clear night in Kiruna, all without app notifications, simply because we went outside and looked. Yes, these were very mild events that were almost impossible to detect with the naked eye, but it certainly illustrates that all the best data in the world does not replace simply going outside and looking!
Here, we have two final tips to share:
First, when the aurora is weak (which is to say, most of the time), it may appear like a faint cloud and not unlike the haze of the Milky Way galaxy. It may not even have color and to your eyes appear white (only intense auroras are colorful to the naked eye due to how our eyes process color in low light). Check with your camera to see if it can pick up any green as cameras can often see the colors better than our own eyes.
Second, while the aurora is almost always active (whether we can see it or not), the oval tends to rotate around the hemispheres as the night progresses. Peak aurora activity, on average (i.e. without an exceptional event), tends to be between 8 pm and 2 am so go outside and look up often during these hours as well.
If Space Weather Live shows the aurora oval is over you, the skies are clear, and you have nothing else to do- go out and look!
Overall, we have to admit that we found that the data for tracking solar and aurora activity was rather confusing. In a way, we can see why so many people rely on KP Index more than we’d recommend simply because the analog is much easier to understand. That being said, if you can learn to read a few charts, check forecasts of solar activity, interpret satellite data from DSCOVR, and go outside and look when the weather is clear, your odds of spotting the aurora will go up considerably.
Is it a guarantee? Unfortunately, no. There are far too many factors to ever say that you will be guaranteed to see the northern lights. But if you follow some of these tips, your odds will likely go up.
Looking for more tips for the aurora borealis? Check out our posts on how to photograph the northern lights and ways to increase your odds of seeing the aurora borealis!
✈️ Book Your Next Trip
- • Planning a trip? Find a flight deal.
- • In need of a room? Check out hotel and Airbnb prices.
- • Taking a cruise? Find a cruise itinerary for your journey.
- • Book a rental car or day tours to explore more as well!
- • Don't overlook travel insurance to protect your trip, too!
About Jeremy

About the Author: Jeremy is a full-time travel writer based in Pittsburgh and primary author of this site. He has been to 80+ countries on five continents and seeks out new food, adventure activities, and off-the-beaten-path experiences wherever he travels.