Published by Jeremy. Last Updated on March 24, 2022.
Disclaimers: Our site uses demographic data, email opt-ins, display advertising, and affiliate links. Please check out our Terms and Conditions for more information. Listed prices and attraction details may have changed since our visit and initial publication.
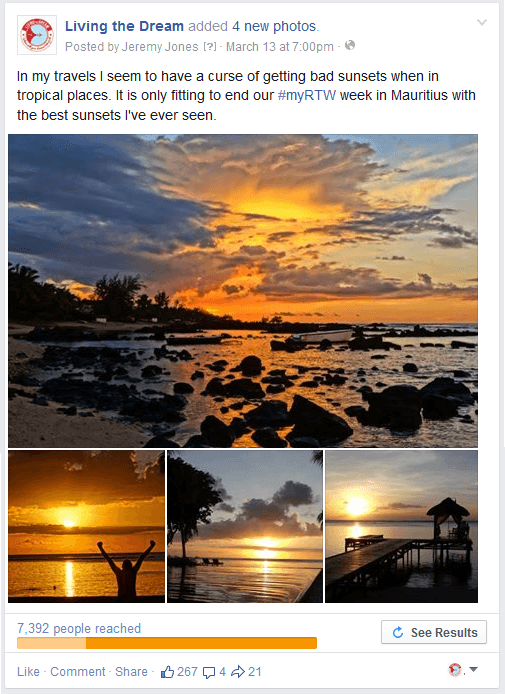
As a part of our #myRTW campaign on social media we are publishing weekly destination features from our travels. Between ourselves and our staff we have covered 75 countries around the world, so we have no shortage of content to put out there for everyone to see.
Now that we have completed fifteen twenty twenty-five weeks of #myRTW updates from around the world, we wanted to take a look at the countries featured on Facebook to see if any significant performers came about.
✈️ Book Your Next Trip
- • Planning a trip? Find a flight deal.
- • In need of a room? Check out hotel and apartment prices.
- • Taking a cruise? Find a cruise itinerary for your journey.
- • Don't overlook picking up a rental car or day tours as well!
Countries Tested
The countries featured so far in this campaign were the following:
Asia: Japan, Jordan, India, Indonesia, Vietnam, China, Thailand, Singapore, Cambodia
Europe: Spain, Bulgaria, Switzerland, France, Greece, Italy, Croatia, Austria, Montenegro
Africa: Mauritius, Namibia, Egypt, South Africa
South America: Bolivia, Easter Island, Colombia, Ecuador, Argentina
North America: Caribbean (mix of several countries)
Our selection of the countries has not followed any hard and fast rules to this point. We looked at some of our favorite countries from around the world and jumped around to try and have an even mix from the continents we have visited so far.
Note: We had originally included Switzerland in our results, but looking back on the data I did not follow my self-imposed rules on that one (outlined below) due to a mistake and I removed it from this list to not provide false data.
Self-Imposed Update Rules for Facebook
In order to be consistent, our update patterns during this period were set as the following:
- 10 image updates and 5 article shares per week. These were spaced out at 2 images and 1 article per day, M-F. If we didn’t have enough articles from a country, we’d omit an update.
- We had unrelated article shares on weekends (not accounted for in this study).
- 2-5 of our best performing updates were boosted for $2-4 each to the countries of our primary audience (USA, Canada, UK, Australia, and most of Western Europe) plus the country of the update itself.
- We would then invite non-connected users who liked an update to follow our page, when available, as a means to increase our following and get more value for the budget.
When possible, we also tried to notify the local tourist board about the feature to encourage shares. Out of 20 countries we successfully notified seven, and a couple actively shared our updates (mostly on Twitter so I can’t speak of it much in this update).
Facebook Results
One of the things that makes Facebook a difficult social network to track data on is that the algorithm displays better performing content while it restricts content that doesn’t do as well.
You could easily share a wonderful update at a bad time and get a minimal number of views, and then later share that exact same update when more users are online and have it explode thanks to getting a few dozen Likes.
This is part of the reason why we boosted the best performing updates once the organic shares have run their course.
So while we boosted our best performing images, the subsequent performance of the image was a mix between the paid component plus any organic gain through the engagement of those who the image was delivered to.
Naturally, this makes it very hard to make distinctions on our end. Did we get an extra 5,000 impressions because of the payment or because we had 20 likes from the boost? This is a level that we’re not going to try and dissect to (because in all honesty, you can’t).
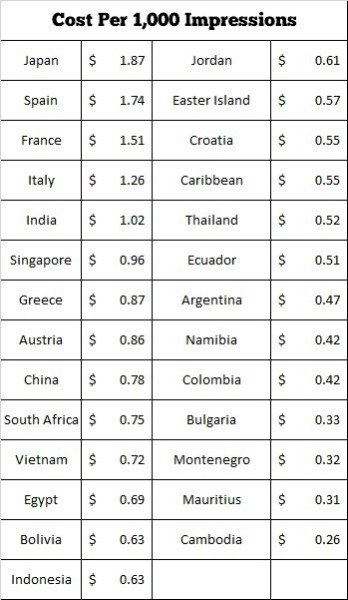
So how did the countries perform on our page? We think the following table is the most telling:
For the most part, this data follows a trend that I would anticipate with larger countries having higher advertising costs and smaller countries costing less. I feel like a few outlying countries (Easter Island in Chile and the Caribbean island nations) probably would cost more on average for most users, but we had exceptionally better photos in those weeks that increased our engagement.
Impressions: This data can be converted into total impressions to look at a things a different way. High cost countries, like Japan, Spain, and France only reached about 5,000 people through boosting $4-$8 over the course of a week (roughly 1:1 with our follower count).
Low cost countries like Bulgaria and Mauritius reached 20,000 and 30,000 people respectively for a similar amount spent. For what it is worth, spending $6 to have 20,000 people see a few updates is not bad at all if your page is 4x smaller than that.
Engagement: In terms of engagement from that reach, we unfortunately could not find a pattern. When taking a broad look it is pretty easy to say that our average engagement rate was around 1% to 4% of the total reach (calculated as # of Likes / # of Impressions * 100).
So for a reach of 10,000 we would have anywhere from 100 to 400 Likes, and for a reach of 30,000 we’d have anywhere from 300 to 800.
New Followers: Getting even more focused, after acquiring Likes on our images we were then able to invite those users to follow our page in return and had 5-20% join.
This means that if you looked at our advertising spend purely by account growth (ignoring the value in increased impressions or Likes), we averaged around 20 cents per Like throughout the duration of this study. Our best performing countries, Egypt and Mauritius, averaged roughly 8 cents per Like each.
When you consider that the best ad I ever ran on Facebook for standalone Likes averaged out to be 8 cents per follower (and has yet to be repeated), getting an extra 30,000 impressions for the same cost isn’t awful!
Conclusion on Facebook Boosting
Overall, it is hard to draw conclusions here due to the complexity of Facebook’s algorithm. But when it comes to advertising boosting is by far my favorite option and I have a few takeaways worth pointing out from this test:
- Boosting updates not only yields increased impressions, but can also bring in a good number of new followers with the same spending as sidebar advertising.
- New users who join a page after liking a boosted post are more likely to engage with your content in the future than those who came in via a customized sidebar ad. My organic impressions have doubled since the start of this study thanks in part to the new fans who continue to follow our updates.
- Targeting the country of the update has allowed me to increase my reach in countries I’ve visited. Unfortunately, boosting in some countries often comes so far under budget that my target market often gets ignored completely in Facebook’s algorithm. Case in point, Egypt was one of the better performing countries, but by checking Egypt as a country to target I’m fairly convinced my ad was displayed mostly in Egypt and Egypt alone even though I had a range of other countries added to the target list.
- Likewise, another flaw is that in many cases these non-typical countries are not my target audience. So their worth over what you’d get from a truly target niche website is up for debate depending on the kind of content you’re promoting. Depending on your goals, some countries are likely less than ideal here.
- Boosting popular images roughly 12-24 hours after posting has allowed me to determine which of my updates is likely to perform well. Having a base number of Likes, shares, and comments also helps those who see the boost feel inclined to participate more.
- Facebook’s anticipated reach for pending ads is horribly inaccurate (sometimes as much as 2,000% off).
- Finally, and this may be a stretch, but I have found that boosting updates that contain multiple images (3-4) and boosting more updates in a week (4 instead of 3 when performing well) have yielded better results. I need to test this one more before I make an official call on it, however.
Cheap Results Are Good, The Right Audience is Better
Overall, it is fairly easy to optimize around an audience and get cheap ad rates, but the most important question is one we have yet to mention: is it the right audience?
If you are a global travel blog with an English speaking audience, going after likes in countries outside your target market makes little sense. Sure, they may like the image you boost (who doesn’t like seeing photos of their country?), but will they care when you post from another country a few days or weeks later? Probably not as much as you’d prefer.
It is because of this that the results here may be a bit deceiving upon first glance.
As with most things, advertising on Facebook may not necessarily be about finding what is the cheapest, but rather finding what is the best fit and for the right geographical audience for your particular niche. Do that, even if it requires more time and money testing, and you’ll come out ahead in the long run.
Have something you’d like us to test in the future? Comment below to let us know about it!
Looking for more information on how to promote your blog? Click the previous link to learn all of our secrets!
Have an existing blog that is in need of an upgrade? Check out the following services we personally use!
- BigScoots - Premium managed hosting with plans as low as $35/month.
- GeneratePress - A customizable theme designed for site speed.
- AdInserter Pro - A widget logic plugin that is quite powerful.
- WP Rocket - An image and caching optimization plug-in.
- Mailerlite - Cost effective newsletter service.
- Keysearch - Keyword research tool for SEO.
- Pretty Links Pro - A great link cloaking tool to clean up affiliate links.
About Jeremy

About the Author: Jeremy is a full-time travel writer based in Pittsburgh and primary author of this site. He has been to 70+ countries on five continents and seeks out new food, adventure activities, and off-the-beaten-path experiences wherever he travels.


Thanks for the research Jeremy!