Published by Jeremy. Last Updated on August 31, 2026.
Disclaimers: Our site uses demographic data, email opt-ins, display advertising, and affiliate links. Please check out our Terms and Conditions for more information. Listed prices and attraction details may have changed since our visit and initial publication.
Welcome to the 138th entry into our monthly income and traffic report!
In this monthly update we share our traffic, earning, and spending figures for our blogs from the previous month so you can get a glimpse inside the business of blogging. In addition to sharing these for your use, by publishing our information we are also able to stay on track with our own goals for our business.
Prior to reading, it is worth noting that we feature two travel blogs in this report (one global and one local) and our income is based on the combined total of the two. We break down the traffic for each in this report for additional information.
August 2026 Travel Blog Traffic Report
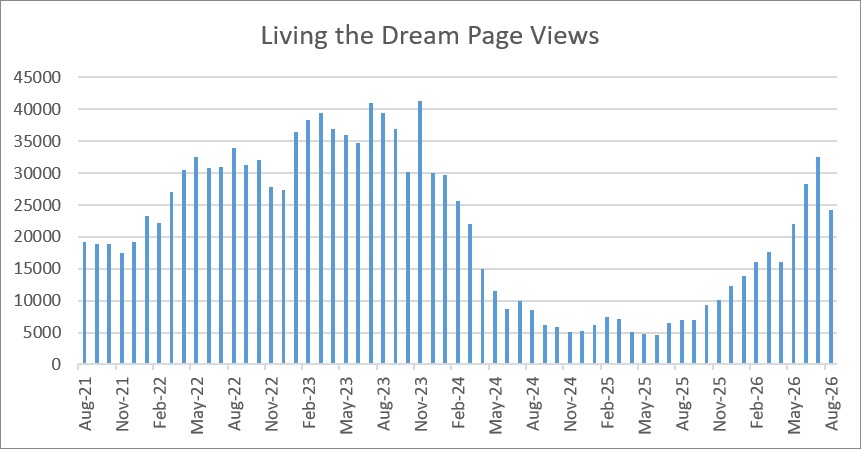
Our traffic on Living the Dream for the month of August was roughly 24,100 page views. This was a decrease of 26% on a per day basis from July and an increase of 245% from August 2025.
Well, the Norway run lasted just as long as they happened to be in the World Cup, which means we saw a notable drop in traffic from about July 11th that carried onward. As such, we’re not surprised that we are down back to roughly where we were in June prior to their impressive run.
But we are still celebrating either way because our traffic is still up 245% year-over-year, our revenue is rising, and we are still in Raptive.
The hard work will continue, as always, but we’re still happy to see a glimmer of hope all the same.
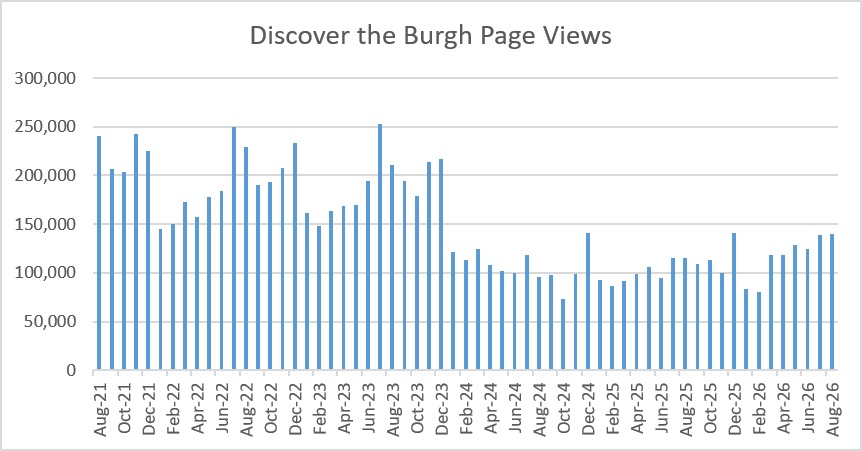
On the Discover the Burgh front, our traffic in August was approximately 140,000 page views. This was an increase of 1% on a per day basis from July and an increase of 21% from August 2025.
August wasn’t too much of a change from July for our local blog. It felt like we had a ton of rain at the beginning of the month alongside perfect conditions towards the latter half, so everything sort of balanced itself out over time between “nothing” to do and everything to do.
Still, as we said last month, we have only recently hit the 140,000 pageview/month mark in the last few Decembers only, and our previous month being higher than that mark at all was December 2023.
Either way, we’ll take it!
August 2026 Travel Blog Income Report
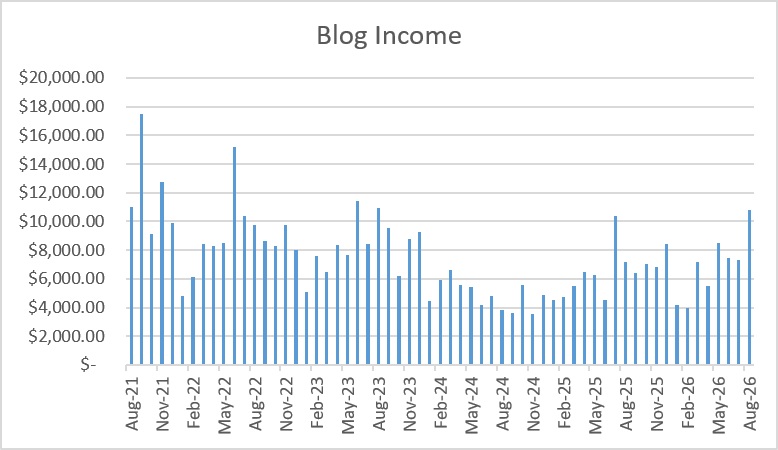
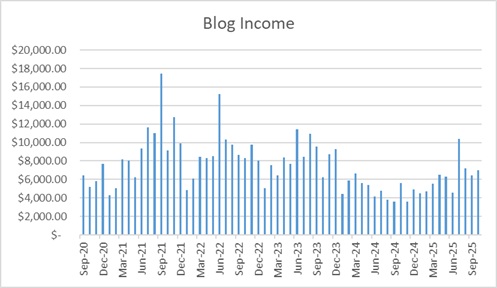
Our booked income for August was approximately $10,800, up approximately 48% per day basis from July and an increase of 50% from August 2025. This income was approximately 90% from our local blog and 10% from our travel blog.
The breakdown includes the approximate following:
*CPM Ads: $4,000
*Sponsored Ads: $4,070
*Affiliates: $1,900
*Book Sales: $355
*Social Bonus: $275
*Consulting: $100
Well, August’s income tally is a sight for sore eyes!
We had a couple of significant local ad campaigns come through, including one from outreach revolving around our book, and really helped us with a massive leg-up from an otherwise conventional month.
Breathing room, we have finally found you!
In all seriousness, we’ve been working behind the scenes on building out new ad options and working on more consistent partnerships, and this is a welcomed sight through and through. Although we know that this is still not going to be consistent month-to-month, it does give us hope that one day we could possibly have some form of a sponsored ad revenue floor like this.
Likewise, breaking $4k on CPM ads doesn’t hurt for its own floor, too. It should only be up from here until the end of the year!
Note: We run more websites in addition to these two travel blogs. This income and expense report only includes income from these two sites. These additional sites were started well after we started this income tracking series, and we have decided not to add those income streams in to keep this one focused on our travel blogs only.
August 2026 Expenses
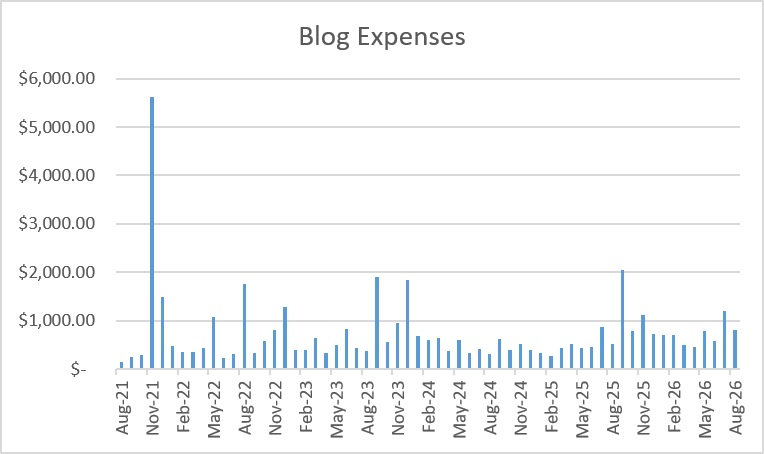
Our dedicated blog expenses* for the month of August were roughly $806 with the following breakdown:
*Programs: $250
*Books: $320
*Advertising: $150
*Instagram Certification: $16
*Domains: $70
August was more towards a baseline month for us apart from purchasing more books for our inventory and renewing a domain. We will continue to try and get to nominal spending for the time being while we evaluate what would actually have value for our business.
If anything, I still want my spending to go down- not up.
*We do not share our travel/local expenses in this report. This can be anywhere from $100-$3,000+ per month extra, but your mileage may vary as the costs to generate content can vary wildly from blog to blog. We strive to only share true blog operating expenses here.
September 2026 Goals
August was a whirlwind month because I was studying for a major wine exam for our wine blog (that I do not include in these income reports). I passed that towards the end of the month, and now can stop having to study for a good chunk of my week.
As of now, we’re pushing creating new articles to our highest priority, as almost all of our sites are seeing some form of upward movement that we haven’t been lucky to have in many, many years- so we’re going to ride that wave as best we can.
Beyond this, I have two major goals for September, and one is to work through updating my pillar articles and top performing posts on my local blog (primarily to add large images, but also updates for relevancy) as well as building out a real estate site for that affiliate goal.
I had a few months of delay on that one as I found out my original intent for the site would not work right now, so I have to pivot into my 2nd choice idea which, while it may not work as well, will be better than nothing.
Finger’s crossed those both can be done before the end of the month!
Looking For Past Reports?
Unlike other websites that host an article series on this topic, we only have one article for our travel blog income and traffic reports.
We do this for a number of reasons, but it is mostly because we do not want dozens upon dozens of posts on our site on this one specific topic. Over time, the monthly details become irrelevant and trends are the only thing that matters.
To compensate for this, we update this article every month based on our current data and publish a graphical summary of previous months as well. If you have any questions about data from a specific month we are happy to share more details via email if you contact us.
Have an existing blog that is in need of an upgrade? Check out the following services we personally use!
- BigScoots - Premium managed hosting with plans as low as $35/month.
- GeneratePress - A customizable theme designed for site speed.
- AdInserter - A widget logic plugin that is quite powerful.
- WP Rocket - An image and caching optimization plug-in.
- Mailerlite - Cost effective newsletter service.
- Keysearch - Keyword research tool for SEO.
Need SEO help? Check out our consulting services!
Hi! How long have you been planning a switch to Raptive? I’m also contemplating switching to Raptive from Mediavine. I have no qualms with Mediavine but have found their RPMs to consistently decline over the years. I’ve received countless emails from Raptive promising higher RPMs but a bit hesitant to change up my whole setup!
So I have had two blogs on Raptive since October 2025 and just got this one (Living the Dream) accepted last month and will be changing over from Journey to Raptive here in about two weeks.
I have some of my full thoughts at https://thisweekinblogging.com/mediavine-vs-raptive/ with my RPM breakdown for my local blog. In Q4 and Q1, my local Pittsburgh blog had excellent YoY increases with Raptive (+50-70%), but so far from April to now I’ve been down about 5-9% YoY. It’s hard for me to compare exactly considering the market at large, so I’m not sure if, for example, Mediavine RPMs have changed much on their own- so your mileage may vary there. I am trying to have my ad setup be virtually identical, for what it is worth.
I am enjoying Raptive and I do think I’m likely making more money overall than when I was on Mediavine, but I was also getting frustrated with other things beyond just the RPMs dropping that made me switch.
On the bright side, you had an increase of 25 percent income from last year. I read your updates with the stats and different information. I have been keeping up with your reports over the last year.
Very true. It’s sometimes hard to see the positives through everything, but you’re absolutely right. Thank you so much for following along too!
Do you think sponsorships or content creation packages for local businesses could be a primary source of income? Either companies paying you to promote their events / service / products on your socials/blog, or creating photo and video content for them to use in their own marketing? I’ve been thinking about how I could do something similar in my city without depending on ad revenue.
It definitely is an option and one I’m exploring more of now that ad income is down. I know many content creators who make way more money than me on sponsored social media posts with brands. But they’re also (mostly) shilling trash and I can’t bring myself to do that. The real struggle is dealing with the fact that local businesses tend to not have a high marketing budget (if any), so the vast majority of inquiries are for coverage for food or a gift card. I’m rolling out some new options that could work, but I haven’t really found something that checks all the boxes just yet.