Published by Jeremy. Last Updated on June 30, 2026.
Disclaimers: Our site uses demographic data, email opt-ins, display advertising, and affiliate links. Please check out our Terms and Conditions for more information. Listed prices and attraction details may have changed since our visit and initial publication.
Welcome to the 136th entry into our monthly income and traffic report!
In this monthly update we share our traffic, earning, and spending figures for our blogs from the previous month so you can get a glimpse inside the business of blogging. In addition to sharing these for your use, by publishing our information we are also able to stay on track with our own goals for our business.
Prior to reading, it is worth noting that we feature two travel blogs in this report (one global and one local) and our income is based on the combined total of the two. We break down the traffic for each in this report for additional information.
June 2026 Travel Blog Traffic Report
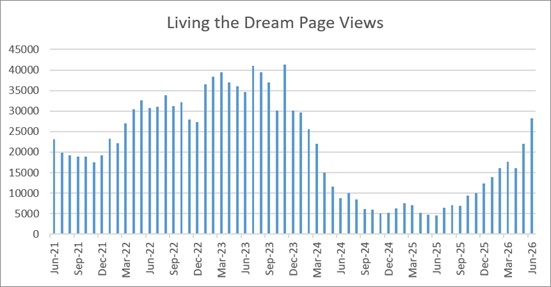
Our traffic on Living the Dream for the month of June was roughly 28,300 page views. This was an increase of 33% per day basis from May and an increase of 515% from May 2025.
We did it. We really did it!
My work in the last year or so was to revive Living the Dream from a May 2025 low of 4.5k pageviews to get over the 25k monthly threshold to join Raptive, and we met that goal in June and also were accepted to Raptive in the middle of the month as well!
Wahoo!
It really feels like we’ve got momentum on our side here, and we’re going to be really pushing in the next few months to get more content out there and continue our updates of old posts to see where we can really take this one.
Yes, we’re still down 70% from our all-time high, but a 500%+ YoY increase is still worth celebrating, and celebrating we are. Finally, some good news!
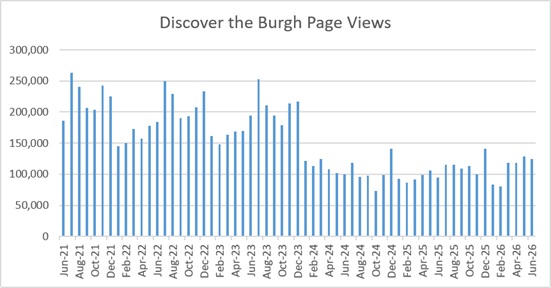
On the Discover the Burgh front, our traffic in June was approximately 125,000 page views. This was an increase of 1% on a per day basis from May and an increase of 32% from June 2025.
Admittedly, we have let our local blog run on its own devices a bit this month because of travel plans and our past efforts to get Living the Dream more traffic, so it is no surprise to us that our traffic is flat month over month.
That said, we’re still seeing a nice rise year over year, which, while a much more conventional amount, is worth a celebration all the same. The last two months have had some of our best non-Q4 traffic in years!
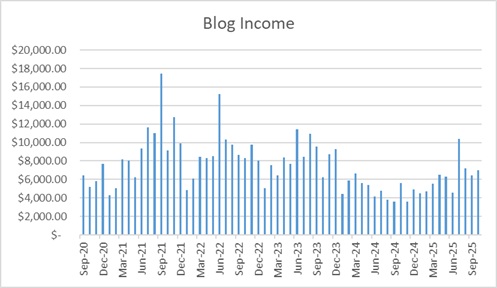
June 2026 Travel Blog Income Report
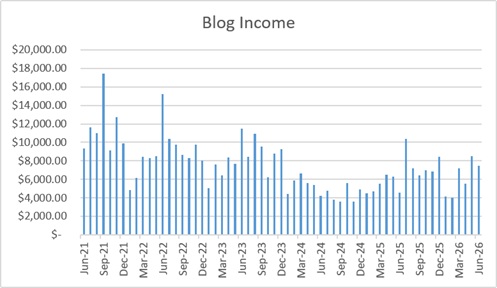
Our booked income for June was approximately $7,450 a decrease of 9% on a per-day basis from May and an increase of 64% from June 2025. This income was approximately 80% from our local blog and 20% from our travel blog.
The breakdown includes the approximate following:
*CPM Ads: $3,750
*Sponsored Ads: $1,070
*Affiliates: $2,150
*Book Sales: $250
*Social Bonus: $230
One nice thing about seeing our travel blog bounce back is we’re seeing a healthy rise in CPM ad revenue, which we expect to go up even more next month when we fully switch to Raptive. Sure, we’re still a far cry from the days when we’d be making $8k, $9k, or $10k+ per month on ads alone, but having a rise to a new floor is always worth celebrating.
We’re also making a healthy push into more affiliate revenue, also stemming from the travel blog growing via our overhauls, and our social bonus and book revenue are still working nicely in our favor for additional passive revenue.
Now if we could only have this monthly total be our low month moving forward, we’d be really grooving.
Note: We run more websites in addition to these two travel blogs. This income and expense report only includes income from these two sites. These additional sites were started well after we started this income tracking series, and we have decided not to add those income streams in to keep this one focused on our travel blogs only.
June 2026 Expenses
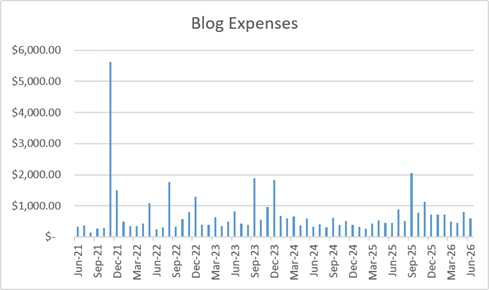
Our dedicated blog expenses* for the month of June were roughly $586 with the following breakdown:
*Programs: $450
*Advertising: $120
*Instagram Certification: $16
As with most months recently, we’re striving to hit a baseline in spending to keep our costs down. That said, we’re starting to explore more programs and services to support our sites now that we are finding momentum again.
On our local blog, we upgraded our social share plugin to Hubbub Pro+ to use their recently updated Save This feature for newsletter subscribers (which we may further upgrade later to use on the rest of our sites) and I am testing out services to build out a new real estate page for my local site as well. I dropped about $150 on that this last month for tools that, sadly, didn’t work out- so that is somewhat lost revenue.
But, either way, there will be some upticks in spending in the coming months as we work towards rolling out some new revenue streams, but if we can still keep our costs in the $500-$750/month range, I’d call that a win.
*We do not share our travel/local expenses in this report. This can be anywhere from $100-$3,000+ per month extra, but your mileage may vary as the costs to generate content can vary wildly from blog to blog. We strive to only share true blog operating expenses here which are necessary to keep our business running.
July 2026 Goals
Now that we have reached our goal of getting Living the Dream on Raptive (which will be switched over in a week or so), my attention is going back to our local blog for more content, another push for our book, and building out more in our real estate venture.
If I could get my bulk email pitches out for the month and headway on building out a new website, which sadly stalled last month due to a poor product I signed up for, I will call that a win. Everything feels slower when you are relying on others as intermediaries, and this is exactly where we are now.
That said, we are taking another short vacation in the middle of the month for our wine blog, but other than that, it is full steam ahead until the end of Q4!
Looking For Past Reports?
Unlike other websites that host an article series on this topic, we only have one article for our travel blog income and traffic reports.
We do this for a number of reasons, but it is mostly because we do not want dozens upon dozens of posts on our site on this one specific topic. Over time, the monthly details become irrelevant and trends are the only thing that matters.
To compensate for this, we update this article every month based on our current data and publish a graphical summary of previous months as well. If you have any questions about data from a specific month we are happy to share more details via email if you contact us.
Have an existing blog that is in need of an upgrade? Check out the following services we personally use!
- BigScoots - Premium managed hosting with plans as low as $35/month.
- GeneratePress - A customizable theme designed for site speed.
- AdInserter - A widget logic plugin that is quite powerful.
- WP Rocket - An image and caching optimization plug-in.
- Mailerlite - Cost effective newsletter service.
- Keysearch - Keyword research tool for SEO.
Need SEO help? Check out our consulting services!
On the bright side, you had an increase of 25 percent income from last year. I read your updates with the stats and different information. I have been keeping up with your reports over the last year.
Very true. It’s sometimes hard to see the positives through everything, but you’re absolutely right. Thank you so much for following along too!
Do you think sponsorships or content creation packages for local businesses could be a primary source of income? Either companies paying you to promote their events / service / products on your socials/blog, or creating photo and video content for them to use in their own marketing? I’ve been thinking about how I could do something similar in my city without depending on ad revenue.
It definitely is an option and one I’m exploring more of now that ad income is down. I know many content creators who make way more money than me on sponsored social media posts with brands. But they’re also (mostly) shilling trash and I can’t bring myself to do that. The real struggle is dealing with the fact that local businesses tend to not have a high marketing budget (if any), so the vast majority of inquiries are for coverage for food or a gift card. I’m rolling out some new options that could work, but I haven’t really found something that checks all the boxes just yet.